Solar Eclipse High-Altitude Ballooning
Summary
- Requisitioned, assembled, and programmed payload electronics to log atmospheric variables during high-altitude ballooning, with a strict timeline to be ready for the 2024 total solar eclipse.
- Completed required lab safety trainings and followed procedures to use tools and handle materials.
- Interpreted diagrams to connect components, stripped wires, and soldered and modified parts as needed.
- Managed regulatory paperwork and coordination with the FAA and team to ensure compliance for all launches.
- Generated flight path predictions and facilitated the successful retrieval of payloads for all flights with real-time location data.
- Presented preliminary work at the Summer Undergraduate Research Program Symposium in 2023.
- Showcased analytical skills with Python to plot interactive geospatial maps of balloon flight paths and visualize the 2024 solar eclipse atmospheric data.
Project Process and Results
(Skip to payload electronics section)
I was selected and received a full-time stipend to work on this project in 2023 as part of the Washington NASA Space Grant Consortium Summer Undergraduate Research Program. The objective was to design and build a weather balloon with a payload of scientific instruments to carry out experiments during the April 2024 total solar eclipse, following NASA's Space Grant Ballooning Project during the 2017 total solar eclipse. Part of my work was assembling and programming the electronics to measure and record atmospheric data using a Sparkfun RedBoard and a BME280 sensor for temperature, humidity, and pressure. I also researched Federal Aviation Administration (FAA) regulations and had my first experience filing a NOTAM for a test launch. We presented our work-in-progress at the University of Washington Summer Undergraduate Research Program 2023 symposium.
After the conclusion of the summer session, I remained on the team and continued working on the payload electronics, now as the electronics lead of the project. I rewrote the code to record the data in a format easier to use for data analysis and also learned to solder wires, which resulted in less clutter. During this time, we formed a registered student organization called the High-Altitude Balloon Student Research Group for the project, which would allow us to get funding from the university as needed.
On March 9, we conducted two back-to-back test launches where I was in charge of generating the flight path predictions, coordinating with the FAA and team, and tracking the real-time positions of the balloons. Despite the balloons ending up flying into the mountains, the payloads of both launches were located and retrieved successfully. These test flights weren't only informative but were also pretty fun, as we were finally able to get our hard work off the ground and obtain some atmospheric data. Afterwards, I used Python to generate these interactive geospatial plots of the test balloons' flight paths with geopandas.
Now, we were going into the final stretch before the total solar eclipse on April 8. During this time, I added a real-time clock module to the payload electronics and finalized the programming. A custom-built muon detector was also added to the payload and modifications were made to the payload structures to improve durability based off lessons learned from the test flights. We traveled to Miamisburg, Ohio for the total solar eclipse with Valley View High School as our launch site. Luckily, the weather was good with mostly clear skies and low winds, meaning we would be able to get a good view of the eclipse.
For launch preparation, I redid the flight path predictions and then did final checks on the electronics before we moved on to helium filling. Filling the balloons proved to be a fun group exercise as the wind began picking up and we had to keep the balloons off the ground since that could damage them and result in premature bursting. At the same time, the wind was a relief as there were no trees around (to prevent the balloons from snagging on one) and very little cloud cover, making it rather hot. After launching both balloons, we were able to rest and watch totality from the ground. As the Sun was covered by the Moon, the horizon began to look like a sunset but in all directions since the Sun wasn't setting in a particular place. Furthermore, as totality continued, it gave way to a cool darkness, and I went from sweating in the heat to putting on a jacket. In addition to watching with eclipse glasses, we also had a solar telescope set up to capture images of the Sun during totality for the Dynamic Eclipse Broadcast Initiative.
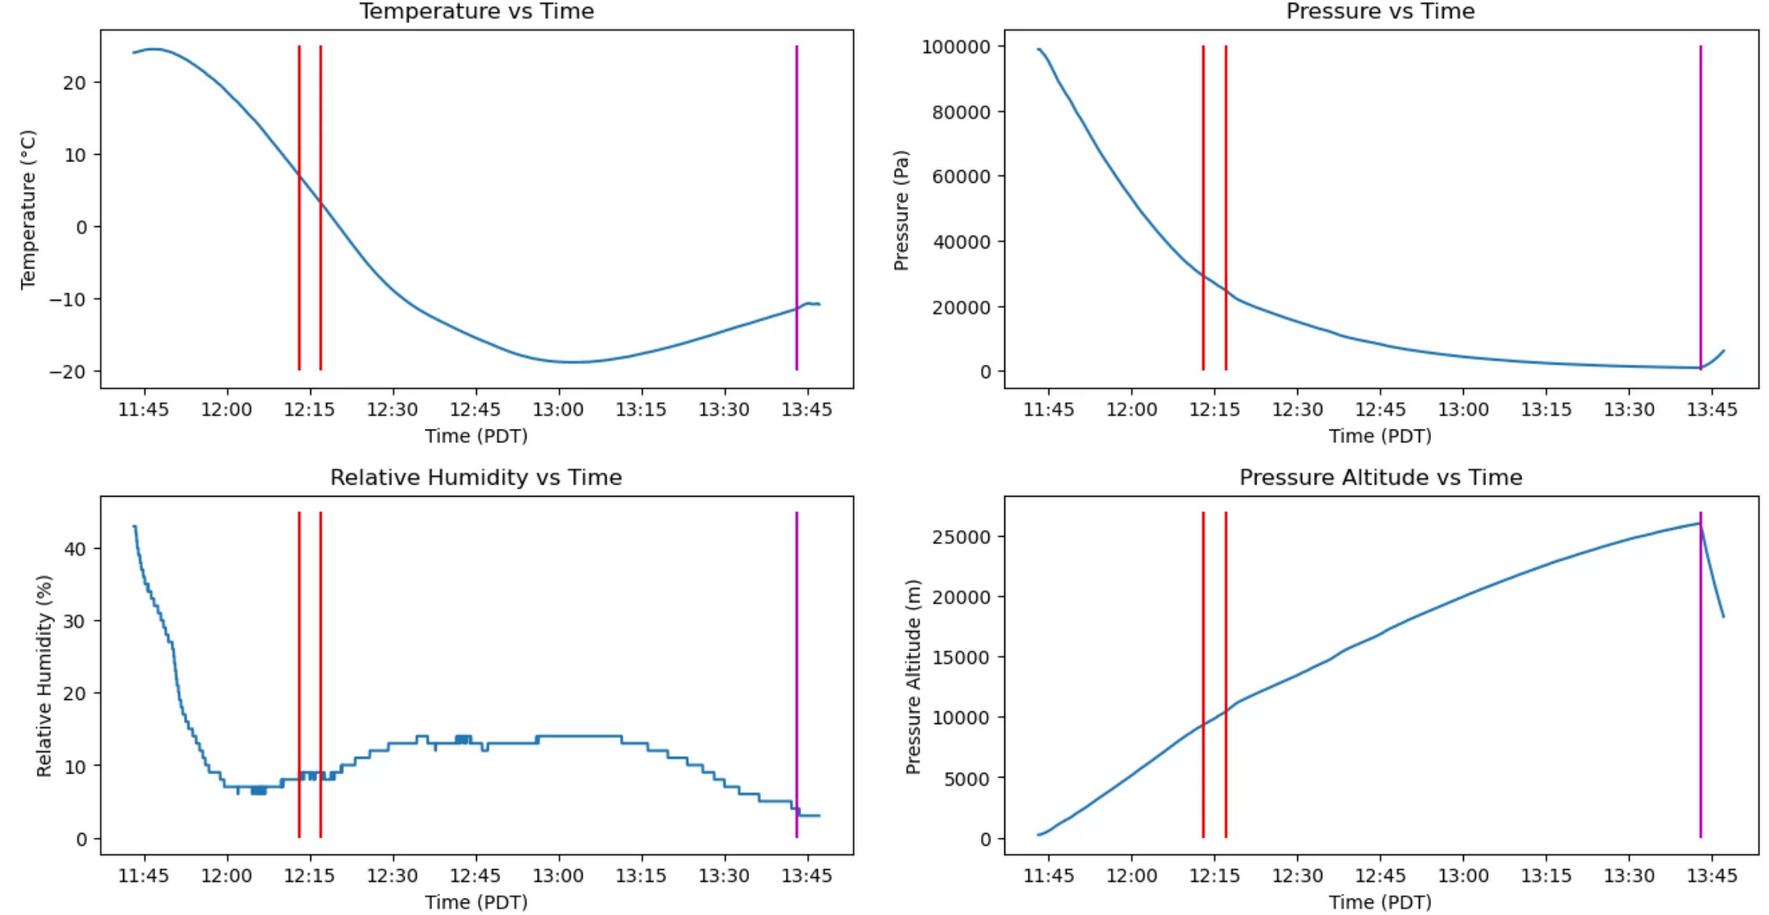
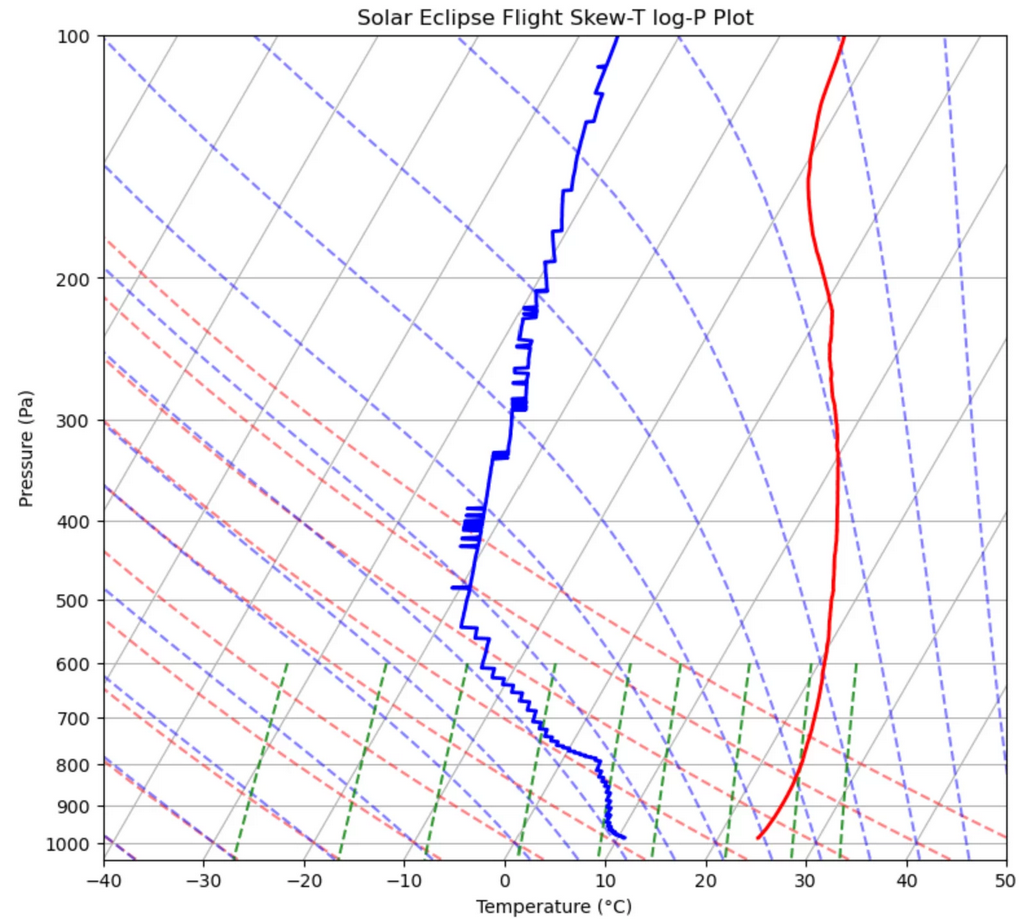
The nice thing about launching in Ohio was that there weren't any mountains for the balloon to fly into, so retrieving the payload was much quicker and easier this time. Below are the plots I created using Python from the data: an interactive geospatial plot of the balloon flight path, graphs of the atmospheric measurements, and a skew-T log-p diagram.
The start and end of totality is shown by the red lines on the plots and the purple line represents when the balloon burst. The first plot in the top left shows the recorded temperature in degrees Celsius over time. As expected, the temperature decreases as the balloon travels higher into the troposphere and starts increasing once it enters the stratosphere at approximately 17 to 20 km in altitude. The temperature at the ground was 24.44 degrees Celsius at 11:43 am PDT and the minimum temperature recorded was -18.81 degrees Celsius at 1:02 pm PDT.
The next plot in the top right shows the measured pressure in Pascals throughout the flight. The pressure measurements were used to calculate the altitude in meters shown in the plot in the bottom right, which was the most reliable way for us to get that data. Therefore, ground level was measured to be 214 meters, the altitude at the start of totality was 8.2 km at 12:07 pm PDT, and the burst altitude was 26 km at 1:43 pm PDT.
The last plot, in the bottom left, is the relative humidity which the percentage of absolute humidity relative to the maximum humidity of the air for its given temperature. This graph looks blockier compared to the rest because the percentage was measured as a whole number (intervals of 1%) which was not as granular as the other measurements.

This is a skew-T log-p diagram generated from the atmospheric data measured up until when the balloon burst. Again, since the relative humidity data had a coarser resolution, the dewpoint temperature line (blue) is less fine than the temperature line (red).

Payload Electronics Design
Here are the materials and code used for the payload that flew for the 2024 total solar eclipse. Each item should be bought once unless otherwise specified.
Materials
- Sparkfun Redboard (link)
- SEEED Grove BME280 (link)
- SanDisk 16GB Ultra microSDHC UHS-I Memory Card with Adapter (link)
- HiLetGo MicroSD Card Adapter (link)
- 9V Lithium Battery (link)
- Note: The battery cannot be alkaline!
- Battery Clip (link)
- Male Header Breadboard Pins (link)
- Male-Female Wires
- SEEED DS1307 Real-Time Clock (link)
- CR1220 Coin Battery
- Note: Although the DS1307 RTC documentation states to use a CR1225 battery, correspondence with SEEED Studio technical support confirmed that a CR1220 battery must be used. While a CR1225 battery will work (and that is what we had to use due to time constraints), it will be a difficult fit!
Design and Assembly
The connections from each component to the Sparkfun RedBoard are given in the format component connection → RedBoard connection. I'd like to draw proper diagrams for these but will write these out this way until I get around to doing that.
microSD Reader
CS → 4
SCK → 13
MOSI → 11
MISO → 12
VCC → 5V
G → G
BME280 Sensor
SCL → SCL
SDA → SDA
VCC → 5V
G → G
DS1307 RTC
SCL → SCL
SDA → SDA
VCC → 5V
G → G
There will be three-way joins for the VCC → 5V and G → G connections, and two-way joins for the SCL → SCL and SDA → SDA connections. Note that the DS1307 RTC uses the same connections as the BME280 sensor, but this is acceptable because they use different addresses to communicate with the board so there is no conflict.
Code
As of writing, there is a known bug with newer versions of the Arduino IDE which will cause an error claiming access is denied to the port when uploading code to the board while the Serial Monitor panel is open. The only fix is to close the Serial Monitor panel and try uploading again.
Make sure to select "Arduino UNO" as the board in the Arduino IDE. When you use the real-time clock for the first time, you must set the time. In the file is code commented out for setting the initial time - just change the values to your current time, run it once, and then comment it out again for all future runs.
Download the code (.ino)